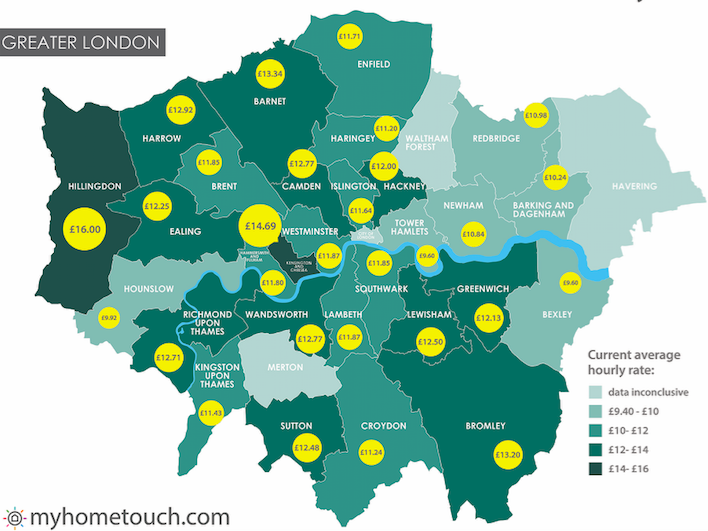
Average hourly earnings across London are at £12.04/hour, over 28% higher than the London Living Wage of £9.40.
Carers working through the hometouch model, now have the flexibility to negotiate and earn a better hourly wage by taking advantage of the new hometouch model of care, that harnesses the on-demand economy.
This has led to better working conditions, higher retention and ultimately better levels of care, in an industry that has become notorious for poor working conditions and pay.
There has been negative backlash to the so called “gig” economy with recent news surrounding Uber and Deliveroo, however, our data shows that across London, carers working through hometouch with a negotiated hourly income earn significantly above the London Living Wage.
When you compare carer earnings to traditional agencies where carers earn minimum wage, it’s not difficult to see that technology can transform the working conditions for committed care professionals.
It’s no secret that the shortage of care workers in the UK combined with our ageing population is at crisis point.
The care industry needs to adapt and we must do more to attract UK care professionals back into the industry, particularly with the uncertainty surrounding Brexit.
Our model, which ensures fair pay coupled with giving clients choice and control has resulted in average annual staff turnover of 10%, compared with an industry average of 32.4% (UKHCA, 2015).
Full data is also available here:
| Borough | AV Rate Charged | Average Rate Earned by Carer | % above National minimum wage | % above London Living wage |
| Hillingdon | £20.00 | £16.00 | 122.22% | 70.21% |
| Kensington and Chelsea | £18.36 | £14.69 | 103.97% | 56.23% |
| Barnet | £16.68 | £13.34 | 85.32% | 41.95% |
| Harrow | £16.50 | £12.92 | 79.44% | 37.45% |
| Bromley | £16.50 | £13.20 | 83.33% | 40.43% |
| Wandsworth | £15.97 | £12.77 | 77.41% | 35.89% |
| Camden | £15.89 | £12.71 | 76.56% | 35.24% |
| Richmond Upon Thames | £15.89 | £12.71 | 76.54% | 35.22% |
| Lewisham | £15.63 | £12.50 | 73.61% | 32.98% |
| Sutton | £15.60 | £12.48 | 73.33% | 32.77% |
| Ealing | £15.31 | £12.25 | 70.11% | 30.29% |
| Greenwich | £15.16 | £12.13 | 68.42% | 29.00% |
| Hackney | £15.00 | £12.00 | 66.67% | 27.66% |
| Westminster | £14.84 | £11.87 | 64.91% | 26.32% |
| Lambeth | £14.84 | £11.87 | 64.87% | 26.29% |
| Southwark | £14.81 | £11.85 | 64.58% | 26.06% |
| Brent | £14.79 | £11.83 | 64.35% | 25.89% |
| Watford | £14.77 | £11.82 | 64.14% | 25.73% |
| Hammersmith and Fulham | £14.75 | £11.80 | 63.92% | 25.56% |
| Enfield | £14.64 | £11.71 | 62.67% | 24.60% |
| Islington | £14.55 | £11.64 | 61.62% | 23.79% |
| Kingston | £14.29 | £11.43 | 58.73% | 21.58% |
| Croydon | £14.05 | £11.24 | 56.08% | 19.55% |
| Haringey | £14.00 | £11.20 | 55.56% | 19.15% |
| Redbridge | £13.73 | £10.98 | 52.50% | 16.81% |
| Newham | £13.56 | £10.84 | 50.62% | 15.37% |
| Barking and Dagenham | £12.80 | £10.24 | 42.22% | 8.94% |
| Bexley | £12.00 | £9.60 | 33.33% | 2.13% |
| Tower Hamlets | £12.00 | £9.60 | 33.33% | 2.13% |
| Total Averages | 12.04 | 67.25% | 28.11% |


